Executing a successful conversion optimization plan requires replacing subjective opinions with structured behavioral data. When I evaluate underperforming funnels, teams often obsess over cosmetic button tweaks instead of addressing checkout friction. This guide provides a repeatable framework to audit traffic, score testing concepts, and execute statistically sound tests within 30 days.
▶ Related Video
Build The PERFECT Homepage with High Conversion Web Design
Before launching experiments, you must configure your analytics baseline properly. Review the official Google Analytics Help documentation to ensure your event parameters capture micro-conversions accurately. Pair these quantitative funnels with a cohesive SEO content plan to ensure your test pages receive steady, intent-driven traffic.
| Roadmap Phase | Primary Objective | Core Deliverable | Typical Cadence |
|---|---|---|---|
| 1. Data & User Audit | Establish quantitative and qualitative baselines | Friction audit report | Days 1–7 |
| 2. Funnel Mapping | Identify primary drop-off stages and leaks | Drop-off priority matrix | Days 8–10 |
| 3. Hypothesis Design | Translate user pain points into testable bets | Hypothesis backlog | Days 11–14 |
| 4. Scoring & Prioritization | Rank opportunities by impact and engineering ease | Ranked test queue | Days 15–16 |
| 5. Test Execution | Run statistically sound A/B experiments | Live split tests | Days 17–28 |
| 6. Analysis & Rollout | Deploy validated winners and log learnings | Production release | Days 29–30 |
Key Takeaways
- Quantitative metrics identify leaks. Funnel reports show which pages drop users, but qualitative tools explain the behavioral friction causing it.
- Prioritize using objective models. Scoring ideas with PIE or PXL frameworks prevents personal opinion from hijacking testing roadmaps.
- Never end experiments early. Always run tests for full business cycles and pre-calculated sample sizes to avoid costly false positives.
- Document every experiment outcome. Failed tests provide critical audience insights that prevent repeating flawed website assumptions.
- Fix bottom-funnel friction first. Optimizing high-intent checkout or lead forms yields faster revenue gains than landing page redesigns.
Establish Your Baseline With Quantitative and Qualitative Auditing
Every effective optimization strategy starts by establishing rigorous quantitative metrics and qualitative behavioral insights. Without a documented baseline, you cannot tell whether a conversion lift represents genuine behavioral change or random seasonality. I always collect 90 days of baseline data before formulating any test hypothesis.
In my experience, teams lean too heavily on quantitative metrics while completely ignoring qualitative user feedback. Analytics dashboards tell you where users leave, but session recordings reveal why they get frustrated. You need both perspectives to build an informed backlog.
- Baseline conversion rates: Track primary macro-conversions alongside secondary micro-conversions across desktop and mobile devices.
- Traffic segmentation: Filter your performance by traffic source, browser type, geographic region, and device resolution.
- Behavioral heatmaps: Deploy click, scroll, and move tracking to pinpoint where users encounter friction.
- Session replays: Watch recorded sessions of abandoned carts to observe rage clicks and broken JavaScript elements.
- On-site customer surveys: Trigger non-intrusive exit-intent polls asking abandoning visitors what prevented them from completing their order.
Deploying tools like Hotjar allows you to observe actual user interactions instead of guessing intent. If your technical architecture requires systemic updates, review our guide on an SEO migration plan to ensure tracking scripts remain intact across domain migrations.
Map the Funnel and Pinpoint Drop-Off Bottlenecks
Funnel mapping pinpoints the exact transition points where visitors abandon your conversion path. To diagnose leaks, map every step between initial acquisition and transaction completion. Look for steep percentage drops between intermediate steps to isolate structural friction.
A common mistake people make is testing headline copy on low-converting landing pages while ignoring high-friction checkout forms. Bottom-of-the-funnel visitors have already displayed high purchase intent; removing a single checkout obstacle yields far greater returns than tweaking top-of-funnel slogans.
According to extensive e-commerce usability research from the Baymard Institute, the average documented online shopping cart abandonment rate exceeds 70%. Most of these abandonments stem from unexpected shipping costs, forced account creation, and overly complicated form fields.
- Catalog or Landing Page: Evaluate bounce rates, navigation clarity, and primary call-to-action click-through rates.
- Product or Offer Page: Check scroll depth, image carousel interaction, variant selection friction, and add-to-cart clicks.
- Cart Review Step: Audit unexpected fee visibility, promo code distraction, and progress indicators.
- Checkout Information: Analyze form field completion rates, address autofill functionality, and mobile payment support.
- Order Confirmation: Monitor confirmation load speeds and immediate order cancellation rates.
For sites managing hundreds of programmatic pages, apply advanced techniques for large-scale content optimization to ensure automated templates do not introduce widespread layout bugs that break user checkout paths.
Formulate Testable Hypotheses from User Behavior
A valid conversion hypothesis must define an observed problem, a proposed modification, and an expected behavioral outcome with psychological rationale. If your hypothesis does not address the underlying customer hesitation, your test is simply a random gamble. Every experiment must test a clear premise.
I structure every experiment using a formal three-part conditional syntax. This methodology forces your team to anchor design decisions directly in verified behavioral audit data rather than executive preferences.
text
Because we observed [specific data or friction point],
we believe that [implementing this specific change]
for [defined user segment] will result in [measurable metric lift]
because [underlying behavioral or psychological rationale].
For example, contrast a weak hypothesis with an actionable, testable one. As documented by testing platform Optimizely, structured hypothesis construction is the single most reliable predictor of long-term experimentation program success.
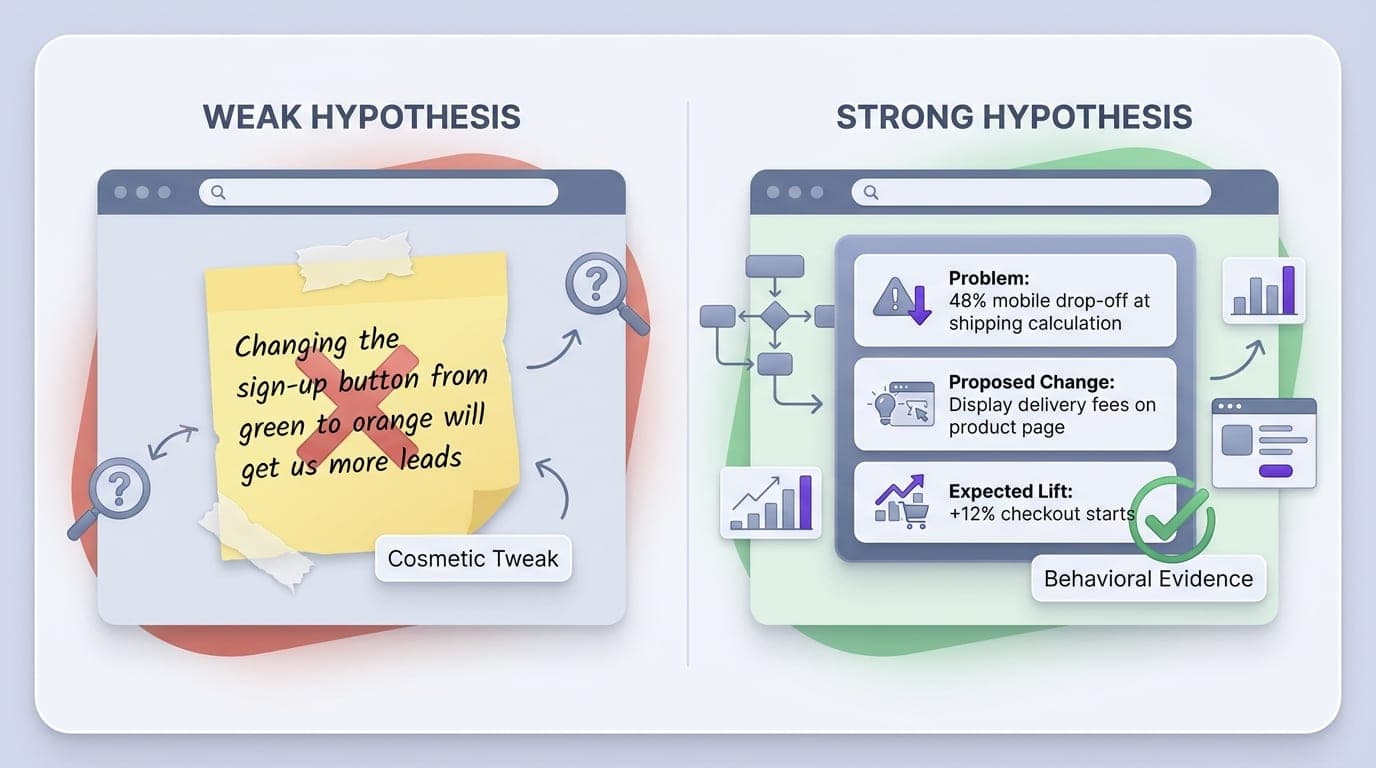
- Weak hypothesis: Changing the sign-up button from green to orange will get us more leads.
- Strong hypothesis: Because 48% of mobile drop-offs abandon at shipping calculation, displaying delivery fees on the product page will increase checkout starts by 12% by removing pricing uncertainty.
- Measurable parameter: Identify one primary metric (e.g., checkout completion) and two guardrail metrics (e.g., refund rate, average order value).
- Audience definition: Restrict test variations to the specific user segments that demonstrated the initial friction point.

Prioritize Testing Ideas Using Structured Scoring Models
Prioritization models prevent political debates by ranking tests through standardized scoring rubrics. When backlog ideas compete for development bandwidth, applying frameworks like ICE, PIE, or PXL establishes an objective ranking system based on expected impact and execution effort.
While smaller teams frequently rely on the ICE framework (Impact, Confidence, Ease), I prefer the PXL framework developed by CXL. ICE relies heavily on subjective gut feeling, whereas PXL forces team members to answer objective, binary questions based on empirical user research.
- PIE Framework: Scores opportunities across Potential for improvement, Importance of traffic volume, and Ease of engineering implementation.
- ICE Framework: Evaluates subjective Impact, Confidence derived from previous tests, and Technical Ease on a 1-to-10 scale.
- PXL Framework: Assigns weighted points based on whether the change addresses verified user survey feedback, mouse-tracking data, or technical bugs.
- Above-the-fold weight: Tests altering visible, above-the-fold content earn higher priority due to superior visitor exposure.
- Development barrier check: Ideas requiring custom API integrations receive lower ease scores and move to later sprints.
“An experiment prioritization model should not be designed to pick winners. Its actual job is to eliminate personal bias and keep your team focused on high-evidence ideas.”
- Peep Laja, Founder of CXL
Before adding tests to your active queue, evaluate their operational viability against your internal schedules. If your team operates on a structured cadence, review our template for an SEO weekly plan to coordinate engineering resources between organic search and conversion initiatives.
Build the Execution Roadmap and Schedule Experiments
A rigorous testing roadmap schedules experiments based on pre-calculated sample sizes and complete business cycles rather than calendar convenience. Running a test without calculating required traffic virtually guarantees uninterpretable results. You must calculate statistical power before pushing code live.
A second critical mistake I see teams make repeatedly is stopping tests prematurely the moment an A/B variation indicates a temporary conversion lift. Peeking at early data causes high rates of false positives because early sample distributions fluctuate wildly before settling into statistical stability.
- Calculate sample size: Determine the exact visitor count per variation using Evan Miller's A/B test sample size calculator based on your baseline conversion rate and Minimum Detectable Effect (MDE).
- Set test duration: Run experiments for at least two complete seven-day business cycles to normalize day-of-week behavioral swings.
- Prevent test pollution: Ensure concurrent split tests run on mutually exclusive user buckets so modifications on one page do not skew results on another.
- Check device compatibility: Validate your variation rendering across iOS, Android, Safari, and Chrome before routing live traffic.
- Monitor server response: Confirm client-side testing scripts do not introduce visual layout shifts or slow down page load times.
Testing documentation published by VWO demonstrates that running experiments through volatile holiday weekends without pre-planned sample parameters frequently invalidates conversion data. Keep experiments running until both the sample threshold and the full weekly cycle conclude.
Analyze Results, Ship Winning Variations, and Document Iterations
A conversion test only concludes when you have verified statistical significance, deployed winning variations permanently into production code, and archived user learnings. Reaching a nominal win means nothing if your engineering team leaves temporary testing scripts running in tag managers indefinitely.
Aim for a minimum statistical significance threshold of 95% (p-value < 0.05) and statistical power of 80%. As highlighted in guidelines by the American Statistical Association, p-values alone do not measure the size of an effect; you must evaluate confidence intervals alongside revenue impact.
- Evaluate confidence intervals: Verify the confidence band remains entirely positive rather than crossing zero.
- Analyze secondary metrics: Check whether higher conversion rates caused an unintended spike in return rates or lowered average order value.
- Conduct segment post-mortems: Determine if the variation won on desktop devices but underperformed on mobile interfaces.
- Hardcode winning variations: Task your development team with deploying native CSS and HTML updates to remove third-party script latency.
- Archive losing experiments: Inconclusive or losing tests provide vital customer insights that prevent teams from repeating rejected concepts.
In my view, losing experiments often teach you far more about customer mental models than quick wins. When an intuitive value proposition fails to move conversion numbers, it reveals that your audience does not perceive value where your internal team assumed they did.
Building an ongoing roadmap requires aligning technical execution with automated page infrastructure. If your organization relies on automated, data-driven landing pages, ProgSEO helps teams build programmatically structured pages that maintain clean conversion baselines across search queries.
Collect both quantitative data (GA4 funnel completion rates, device drop-offs, and bounce rates) and qualitative data (session replays, click heatmaps, and on-site exit surveys). You need at least 30 to 90 days of consistent baseline metrics before building test hypotheses.
Sample size depends on your baseline conversion rate, your desired Minimum Detectable Effect (MDE), statistical power (typically 80%), and your significance threshold (typically 95%). Use verified statistical calculators like Evan Miller's tool to determine the exact visitor count per variation before launching.
Keep experiments active until you reach your calculated sample size and complete at least two full business cycles (usually 14 to 28 days). Running tests for full weekly cycles accounts for weekend purchasing shifts and prevents premature conclusions.
Document the flat result, archive the user behavior data, and roll back the test variation. A flat result means the variable tested did not influence purchase friction; use that finding to pivot your next hypothesis toward a more impactful bottleneck.
Sources & References
- Google Analytics Help — Official documentation covering funnel exploration and custom event configuration.
- Hotjar — Qualitative analytics platform providing behavioral heatmaps and user session replay data.
- Baymard Institute — Large-scale e-commerce usability research documenting online shopping cart abandonment benchmarks.
- Optimizely — Experimentation platform guidelines covering hypothesis construction and split testing management.
- CXL — Conversion optimization research institute that developed the PXL test prioritization model.
- Evan Miller's A/B Testing Tools — Statistical sample size calculator for two-tailed binomial split testing.
- VWO — A/B testing software guides on test duration modeling and statistical significance testing.
- American Statistical Association — Professional statistical body providing regulatory statements on p-value interpretation.