
To generate consistent commercial growth, you need an end-to-end conversion optimisation strategy grounded in user research, structured hypotheses, and disciplined validation. Executing this process requires clean tracking, four to six weeks per experimental cycle, and a commitment to objective measurement over executive intuition.
▶ Related Video
How To Increase Conversion Rate On Shopify (2025 CRO Guide)
Most growth teams burn through testing cycles by randomly changing button colours or copying competitor landing pages. When I audit lagging digital funnels, I look past surface-level vanity metrics to find structural friction points where users abandon purchasing journeys.
Key Takeaways
- Research dictates win rates. Over 80% of successful conversion experiments originate from user research rather than cosmetic design trends.
- Use objective scoring models. Score test proposals using frameworks like PXL or ICE to eliminate internal bias and prioritize revenue impact.
- Protect statistical validity. Pre-calculate sample sizes and run tests for at least two complete business cycles to avoid false positive traps.
- Clarify value before design. Removing anxiety and clarifying your core value proposition yields substantially higher conversion gains than tweaking page styling.
- Document inconclusive tests. Institutional learning requires archiving non-winning tests so past mistakes never pollute future product roadmaps.
Building a Strategic CRO Framework Instead of Guessing
An enterprise conversion rate optimization (CRO) program is not a collection of clever tactical tricks; it is an operating system. A functional framework coordinates user telemetry, behavioral psychology, and rigorous statistical analysis into an ongoing feedback loop.
In my experience, treating conversion optimization as an ad-hoc sprint task is the fastest way to waste resources while learning absolutely nothing about your audience. When teams test isolated variables without research, their win rate rarely exceeds 15%.
| Framework Stage | Primary Activity | Key Deliverable | Typical Cadence |
|---|---|---|---|
| Phase 1: Discovery | Funnel analytics, heatmaps, and survey audits | Friction Diagnostic Report | Weeks 1–2 |
| Phase 2: Hypothesizing | Root-cause diagnosis and PXL scoring | Ranked Testing Backlog | Week 3 |
| Phase 3: Execution | Variant development, QA, and traffic allocation | Live Controlled Experiment | Weeks 4–6 |
| Phase 4: Synthesis | Statistical validation and learning extraction | Post-Test Knowledge Archive | Post-Experiment |
Aligning your conversion architecture directly with an actionable SEO strategy plan PDF ensures you capture search intent while delivering landing experiences configured to turn high-intent organic visitors into paying customers.
- Quantitative Discovery: Pinpoints the exact pages, form fields, and device types suffering from extreme drop-off rates.
- Qualitative Investigation: Uncovers the emotional drivers, objections, and confusion causing users to leave.
- Prioritized Roadmapping: Sequences test concepts based on technical feasibility, business confidence, and revenue impact.
- Closed-Loop Governance: Archives all statistical test results to continuously inform product, design, and marketing messaging.
Conversion Research: Auditing Quantitative Drops and Qualitative Friction
Quantitative telemetry answers where visitors bounce, while qualitative data reveals why they abandoned. Relying solely on raw analytics is like trying to diagnose a complex engine issue by merely reading the speedometer.
I start my quantitative audit by mapping funnel drop-offs inside Google Analytics 4 documentation. I isolate metrics across critical dimensions: browser engine, operating system, traffic acquisition source, and screen resolution to isolate technical regressions from usability bugs.
Once I know where drop-offs spike, I deploy qualitative diagnostics to uncover user sentiment. The Baymard Institute checkout study found that an average checkout contains nearly double the form fields truly required by payment gateways.
- Session Replays: Watch 30 to 50 sessions of users who reached the checkout step but abandoned without interacting with payment fields.
- On-Site Micro-Surveys: Trigger single-question polls when a user exhibits exit-intent on pricing pages to capture immediate purchase objections.
- Post-Purchase Surveys: Ask recent buyers: 'What was the single biggest friction point or concern that nearly stopped you from completing your purchase today?'
- Customer Support Tickets: Mine live-chat transcripts and support tickets for repetitive customer questions regarding shipping, pricing, or contract terms.
My firm opinion is that twenty customer interview recordings will reveal more actionable optimization opportunities than six months of staring at high-level funnel summaries. Behavioral evidence always trumps internal speculation.
When configuring your measurement stack, balance your tools across distinct categories so engineering overhead remains light while observation remains complete:
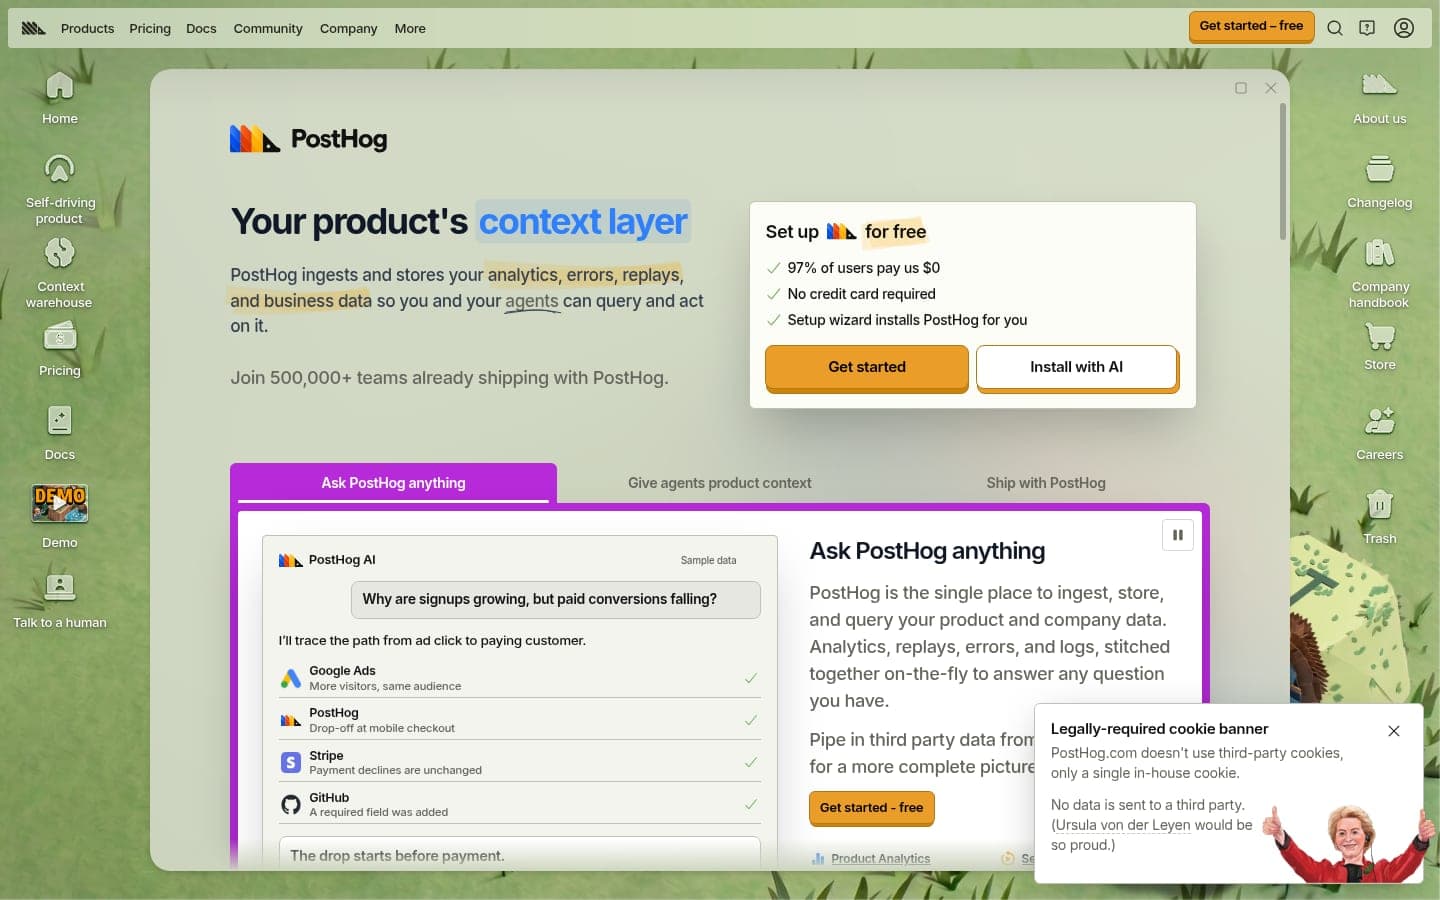
- Web Analytics: Tools like Google Analytics or PostHog for measuring macro conversions, revenue pipelines, and visitor demographics.
- Behavioral Tracking: Platforms like Hotjar for tracking click density, page scroll limits, and form field abandonment.
- Usability Testing: Dedicated panels to watch unbiased target users attempt complex workflow tasks on your production staging environment.
Structuring Valid Hypotheses and Objective Prioritisation
A test idea without a causal hypothesis is not an experiment; it is a gamble. Every test you propose must follow a strict, testable structure that outlines the proposed intervention, the expected behavioral reaction, and the underlying research proof.
“If we implement [specific change], we expect to observe [measurable outcome] because user research demonstrated [specific friction point or user objection].”
- The Standard CRO Hypothesis Blueprint
For example: 'If we replace the multi-tiered pricing table with a simplified feature matrix and upfront annual billing toggles, we will increase trial activations by 12% because exit surveys showed 34% of visitors found our plans confusing.'
Once your team compiles a backlog of twenty or thirty hypotheses, you must score them objectively. I have observed many marketing departments fall into the trap of letting the highest-paid person's opinion (HiPPO) determine the testing queue.
While traditional teams lean heavily on basic ICE scoring (Impact, Confidence, Ease), I find standard ICE too subjective unless you apply strict grading criteria. Anyone can claim a feature has a '10' for impact without offering verifiable proof.
- Impact: How many visitors see this page, and what percentage of revenue flows through this specific funnel touchpoint?
- Confidence: Is this hypothesis based on gut feeling (score 1) or verified by multiple qualitative recordings and analytics reports (score 10)?
- Ease: Can engineering implement this change inside our testing tool in under two days, or does it require database architecture changes?
For advanced experimentation backlogs, refer to the objective scoring parameters published on the CXL prioritisation framework. Their binary PXL model replaces subjective grading with hard criteria, such as whether a change is above the fold or validated by user feedback.
A common mistake teams make here is prioritizing minor aesthetic tweaks—like button colors or icon styles—because they are easy to deploy. These superficial changes rarely move the needle on macro conversions.
Experimentation Methodology and Statistical Rigour
A conversion test is invalid if you do not control for sample size, runtime variance, and statistical error rates. Concluding an experiment prematurely simply because the variation shows an early lead is the single most common testing mistake I encounter.
Before deploying any variation via testing platforms like Optimizely, calculate your required sample size in advance. Use Evan Miller's sample size calculator to establish the exact number of conversions required per variant.
To prevent false positive declarations—known in testing statistics as Type I errors—your testing protocol must uphold non-negotiable operational thresholds:
- Statistical Significance (95% Confidence): A standard alpha threshold where the probability that an observed outcome occurred by chance is under 5%, as detailed in the overview of statistical significance on Wikipedia.
- Statistical Power (80% Minimum): The probability of correctly detecting a true conversion lift when one genuinely exists, minimizing Type II false-negative risks.
- Minimum Test Duration: Tests must run for at least two full business cycles (typically 14 to 28 full days) to account for day-of-week purchasing fluctuations.
- Sample Size Threshold: Never declare a variant winning until it accumulates at least 350 to 500 conversions per branch, regardless of the reported confidence percentage.
In my opinion, checking test dashboards daily and calling winners after forty-eight hours is actively damaging to your business. Early statistical spikes almost always regress to the mean once full weekly traffic patterns normalize.
If your site lacks the traffic volume to complete an A/B test within 30 days, do not run split tests. Instead, deploy high-impact improvements directly to production and monitor longitudinal conversion trends across equal pre- and post-deployment windows.
Core Behavioral Levers: Clarifying Value and Removing Anxiety
Conversion rate gains come from aligning your interface with human psychology, not from exploiting deceptive visual gimmicks. When users hesitate to convert, it is almost always caused by an ambiguous value proposition, excessive cognitive effort, or deep purchase anxiety.
To reduce user hesitation, align page layouts with the fundamental usability principles outlined in Nielsen Norman Group's usability heuristics. The system must match real-world mental models and provide clear error prevention throughout every transaction phase.
Similarly, when structuring expansive catalogs or resource hubs, integrating an intentional internal linking strategy guides users smoothly down the discovery funnel while reinforcing thematic relevance for critical landing pages.
- Value Proposition Clarity: Answer the user's primary mental question—'Why should I choose this over every alternative?'—within the hero section before forcing them to scroll.
- Cognitive Load Reduction: Strip away secondary buttons, redundant links, and extraneous navigation menus on dedicated transaction and lead collection pages.
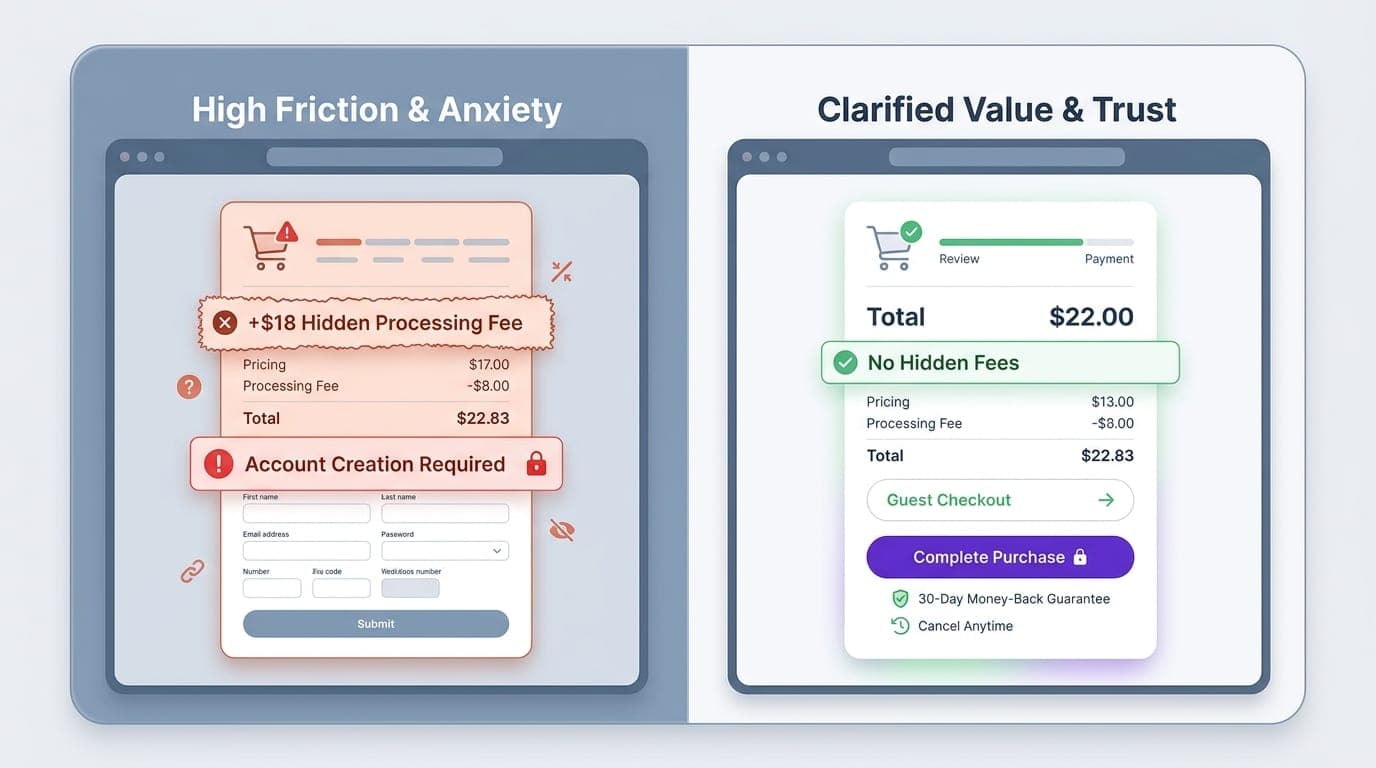
- Anxiety Mitigation: Place clear guarantees, secure payment badges, explicit delivery dates, and transparent cancellation terms directly adjacent to the primary conversion button.
- Friction Removal: Remove optional form inputs, implement automatic address lookups, and allow guest checkouts to prevent forced account creation barriers.
I strongly believe that removing checkout anxiety—by clarifying refund terms and eliminating hidden fees—produces triple the conversion lift of adding automated 'someone just bought' notification popups.
If you manage high-traffic properties within an enterprise SEO strategy, subtle behavioral optimizations across programmatic landing pages can produce millions of dollars in net-new pipeline without purchasing an additional dollar of advertising.
Post-Experiment Analysis and the Institutional Knowledge Loop
The value of an experiment does not vanish if the variation loses. A failed test that decisively invalidates an assumption about customer preferences is worth far more to your organization than an accidental 2% win that cannot be explained.
When a test concludes, perform secondary segmentation before merging code into production or discarding the branch. Break down the results by traffic channel, new versus returning visitors, and mobile versus desktop users.
- Segmented Lift Analysis: Verify whether a flat overall result masks a major conversion gain on desktop that was dragged down by a mobile rendering defect.
- Downstream Revenue Verification: Confirm that an increase in sign-ups or micro-conversions did not lead to a spike in refunds, chargebacks, or qualified lead churn.
- Centralized Knowledge Repository: Maintain a searchable database detailing the hypothesis, sample size, screenshots, quantitative outcome, and key takeaway for every test.
My firm perspective is that an experimentation program without a centralized archive is doomed to run the same five failed tests every two years as internal marketing personnel turn over.
As your experimentation culture matures, you will discover that steady 5% gains compound rapidly across your acquisition funnels. Building an engine that continually tests high-conviction ideas is what separates enduring brands from organizations that constantly chase superficial growth hacks.
If you are looking to scale organic acquisition alongside on-page optimization, ProgSEO provides programmatic landing page automation that helps capture high-intent search traffic efficiently.
Start by auditing quantitative data in tools like Google Analytics to spot funnel drop-offs, then use qualitative session recordings to find the underlying causes. Structure testable hypotheses, prioritize them with an objective scoring model like PXL, and validate changes using pre-calculated sample sizes over 14 to 28 days.
Use quantitative funnel reporting to pinpoint the precise URLs and form fields where bounce rates spike. Then, review session replays, click heatmaps, and post-purchase surveys on those exact pages to diagnose user confusion, missing information, or technical errors.
Score backlog items using the ICE (Impact, Confidence, Ease) or PXL frameworks. Prioritize tests supported by qualitative user feedback and pages with significant traffic volume over low-traffic pages or subjective design preferences.
Calculate your required sample size before launching, enforce a 95% statistical significance threshold alongside 80% statistical power, and run tests for at least two full business cycles (14–28 days) to eliminate day-of-week and seasonal bias.
Sources & References
- Google Analytics Support — Technical documentation on tracking event funnels and conversion drop-offs.
- Baymard Institute — Comprehensive e-commerce usability benchmarks on checkout form field friction.
- Hotjar — Product details and behavioral mapping methodologies for heatmaps and recordings.
- PostHog — Open-source product telemetry, event tracking, and funnel analysis documentation.
- CXL — In-depth guide detailing objective prioritization methodologies including the PXL model.
- Optimizely — Platform documentation outlining enterprise client-side and server-side testing practices.
- Evan Miller A/B Testing Tools — Open-source statistical calculators for two-tailed sample size requirements.
- Wikipedia — Foundational principles of statistical significance, hypothesis testing, and p-values.
- Nielsen Norman Group — Industry standards for interface usability, cognitive load reduction, and user interaction.